What I Learned Building a ClickHouse-Powered App End-to-End (Provisioning, Ingest, Deploy)
Today I learned how to go from zero infrastructure to a live, public analytics app backed by ClickHouse Cloud.
The key objective was not “make charts,” but prove ClickHouse performance in a way people can see: real dataset, real queries, and visible query-cost metrics (rows read, compute time) on the page.
Project goal
I wanted to build a demo website that answers three questions quickly:
- Can I provision a cloud ClickHouse service and use it immediately from code?
- Can I ingest a large public dataset without fragile manual extraction steps?
- Can I show, inside the UI, why schema + rollups matter for performance?
So I built a full-stack Next.js app and connected it to ClickHouse Cloud with production deployment on Vercel.
Dataset choice: MusicBrainz
I picked the MusicBrainz public full export because it is:
- large enough to stress test realistic queries,
- open/publicly documented,
- structured (artist, area, etc.), which is good for dimensional analytics.
Data source used:
Final loaded scale in this project:
- ~2.8M artist rows in
music_stats.mb_artist
Architecture
- Database: ClickHouse Cloud
- App: Next.js (App Router, server runtime)
- Charts: Recharts
- Deploy: Vercel
- Data flow: MusicBrainz dump → streaming transform → ClickHouse
I intentionally kept the architecture simple:
- heavy lifting in SQL,
- thin server-side query layer in Next.js,
- visual layer mostly presentational.
Step 1: Provision ClickHouse Cloud and verify connectivity
After creating the ClickHouse Cloud service, I validated access with plain HTTP first:
curl --user 'default:<password>' \
  --data-binary 'SELECT 1' \
  'https://<service-host>.clickhouse.cloud:8443'
This is a useful first check because it avoids introducing app complexity too early.
Step 2: Create base schema
I started with a single fact-like table for artist-level analytics, plus supporting tables for dimensions/rollups.
Core table idea:
mb_artiststores artist identity fields + area ID + activity flags + update metadata.mb_areastores area labels for joins.mb_artist_area_rollupstores pre-aggregated counts by area for fast charts.
Step 3: Ingest at scale using a streaming pipeline
I did not want to download and fully unpack giant files in working directories. Instead I used a streaming pattern:
curl -L -s "$DUMP_URL" \
  | tar xOjf - mbdump/artist \
  | awk -F '\t' 'BEGIN{OFS="\t"} {ended=($17=="t"?1:0); print $1,$2,$3,$4,$11,$12,$13,$14,$15,$16,ended,$18,$19}' \
  | curl --user "$CLICKHOUSE_USER:$CLICKHOUSE_PASSWORD" \
    --data-binary @- \
    "$CLICKHOUSE_URL/?query=INSERT%20INTO%20music_stats.mb_artist%20FORMAT%20TabSeparated"
Why this works well:
- no custom ETL framework needed,
- easy to reason about each stage,
- no full local extraction for the large fact table,
- can be wrapped in scripts and rerun.
I used the same approach for mb_area to bring in human-friendly labels.
Step 4: Build the app with query-cost telemetry
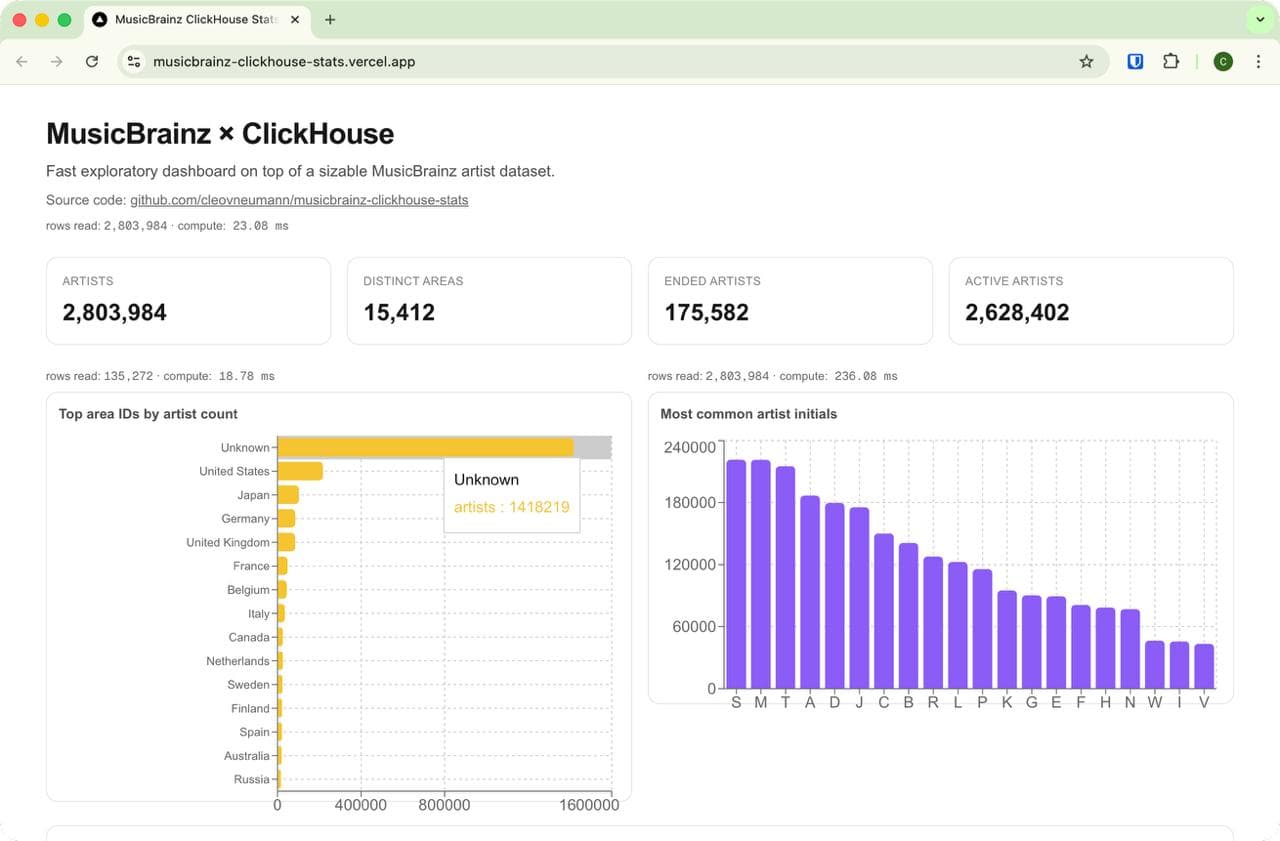
The dashboard is server-rendered from ClickHouse queries. For each section, I also surfaced ClickHouse statistics:
rows readelapsed(converted to ms)
That made each panel self-explanatory from a performance perspective.
Example visible outcome:
- raw top-area query reads millions of rows,
- rollup-based version reads only thousands,
- latency drops accordingly.
Step 5: Add materialized rollups for speed demo
To make performance differences obvious, I added a rollup table and materialized view for area-level counts.
CREATE TABLE music_stats.mb_artist_area_rollup (
  area_id UInt32,
  artists UInt64,
  active_artists UInt64,
  ended_artists UInt64
) ENGINE = SummingMergeTree
ORDER BY area_id;
Then I used two versions of the same logical chart query:
- Raw table path (scan
mb_artist) - Rollup path (scan
mb_artist_area_rollup)
Displaying both costs side-by-side gave a concrete “ClickHouse + modeling” story, not just a claim.
Step 6: Pareto analysis
I added a Pareto panel to show concentration by area.
One important detail: I explicitly excluded the Unknown area bucket in Pareto, because it can dominate and hide distribution patterns in known regions.
That small modeling choice changed interpretation a lot and is a good reminder to be explicit about data quality buckets.
Step 7: Deploy on Vercel
I deployed with Vercel CLI and configured production env vars:
CLICKHOUSE_URLCLICKHOUSE_USERCLICKHOUSE_PASSWORDCLICKHOUSE_DATABASE
I also pinned runtime/region choices to keep ClickHouse access reliable from server-side code.
What went wrong (and what I learned)
1) Live table truncation causes temporary empty dashboards
I did a truncate + reload on the live table during full ingest, which made the dashboard blank during the operation.
What I’d do next time:
- load into a staging table,
- validate counts,
- atomically swap names.
2) Dimension table drift breaks labels
If mb_area is empty/outdated, area charts fall back to IDs/Unknown.
Fix:
- reload dimension,
- rebuild rollup,
- verify top-N joins with a direct SQL check before redeploying.
3) Performance should be shown, not assumed
Adding query telemetry near each chart changed the quality of the demo immediately. It turns “it seems fast” into “here are the numbers.”
End result
- ClickHouse Cloud provisioned and wired into a full-stack app
- Full dataset loaded (~2.8M artists)
- Public dashboard deployed with query telemetry
- Pareto + rollup speed comparison included
Deployment URL:
GitHub repository:
If you want to replicate this
Start in this order:
- Provision ClickHouse Cloud and verify with a single
SELECT 1 - Build one table + one query end-to-end in your app
- Add ingestion script with streaming pipeline
- Add one rollup for one expensive chart
- Add query telemetry to every panel
- Only then scale up full ingest + deploy
That sequence keeps failure modes isolated and makes debugging much easier.
Links
- ClickHouse Cloud: https://clickhouse.com/cloud
- MusicBrainz data dumps: https://data.metabrainz.org/pub/musicbrainz/data/fullexport/
- Deployed demo: https://musicbrainz-clickhouse-stats.vercel.app
- Source code: https://github.com/cleovneumann/musicbrainz-clickhouse-stats